Financial inclusion depends on understanding who is being left out of credit markets, and why. This project uses data-driven segmentation, rather than predetermined rules, to reveal the natural structure hidden inside credit-constrained households.
The problem
A significant share of households face barriers to accessing credit, but "credit-constrained" is not one homogeneous group. Traditional analyses lean on fixed segmentation criteria and risk missing subtler patterns. The goal here was to let the data speak: apply unsupervised learning to the Federal Reserve's 2019 Survey of Consumer Finances (SCF) and discover distinct household segments that call for different products and policy responses.
Approach
The pipeline was built and run on Azure Databricks for scalable, reproducible compute, and combined four analytical stages:
- Multi-criteria constraint flagging: households were marked as credit-constrained using explicit application denials, discouraged (self-censored) borrowing, and excessive debt-service-to-income ratios, capturing both revealed and latent constraints.
- Feature engineering & selection: median/mode imputation, engineered financial ratios (debt-to-income, leverage), log transforms for skewed monetary variables, and variance-threshold filtering to drop low-information features.
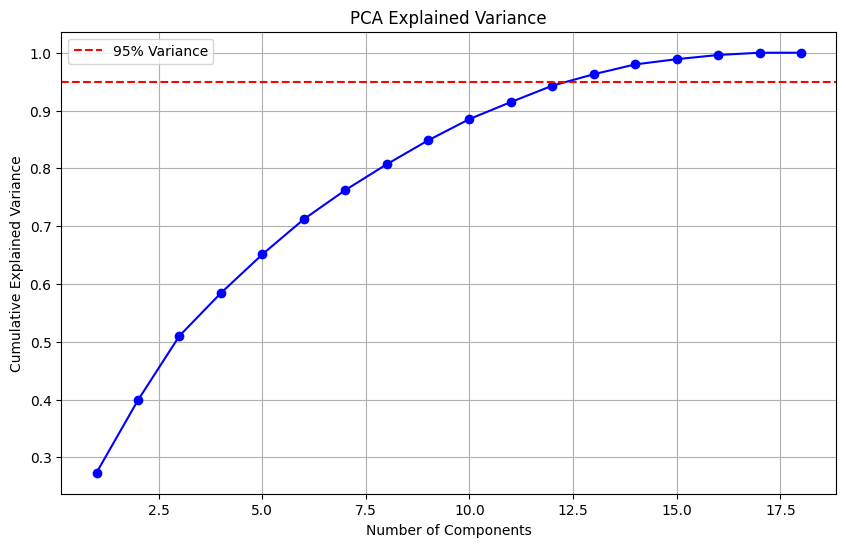
- Dimensionality reduction: Principal Component Analysis automatically retained the components needed to preserve 95% of variance, cutting noise and compute cost while keeping structure.
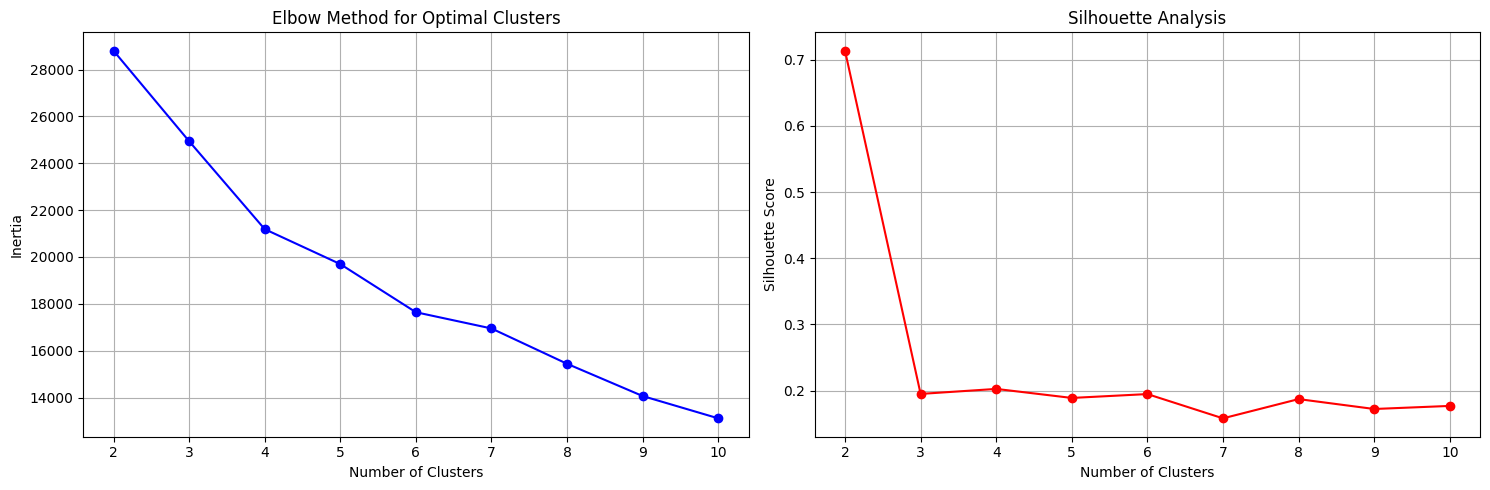
- Clustering & validation: K-Means with fixed seeds and multiple initialisations, with the number of clusters chosen jointly by the elbow method and silhouette analysis.
Results
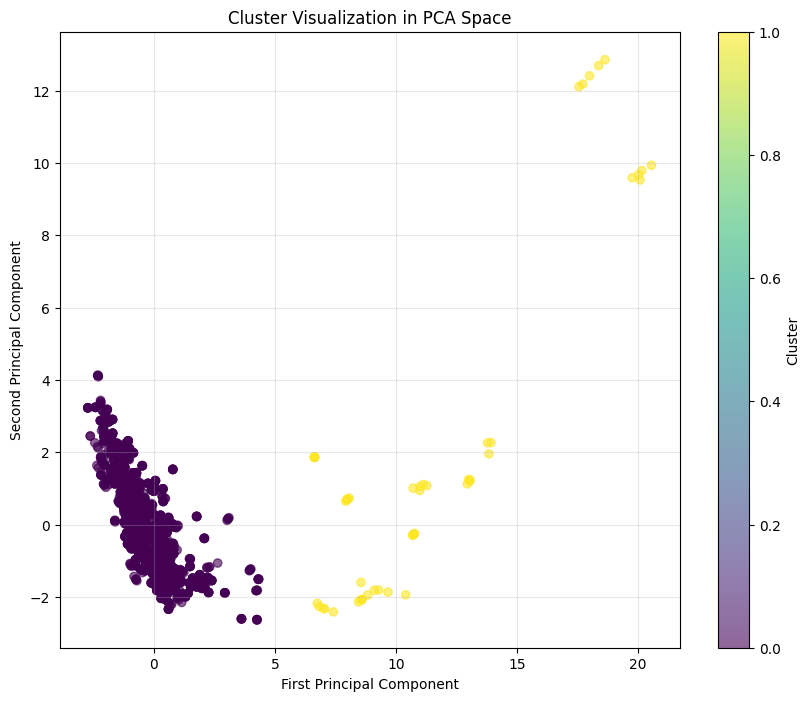
Both validation methods agreed on two clusters. The silhouette score peaked at 0.713 at k = 2, indicating strong, well-separated clusters, before dropping sharply to 0.195 at k = 3. The segmentation was stable across random initialisations and produced reasonably balanced group sizes.
Headline: a silhouette score of 0.713 indicates excellent cluster separation. This is unusually clean structure for household survey data, giving confidence the two segments are real rather than artefacts of the method.
The two segments
High-risk constrained
- Higher debt-to-income ratios
- Lower liquid asset holdings
- More likely to be turned down for credit
- Typically younger heads with limited credit history
Moderate-risk constrained
- Stronger overall financial position
- Constraint driven mainly by discouraged borrowing
- Higher incomes but still facing access barriers
- More established households with complex needs
Why it matters
The two profiles ask for genuinely different responses:
- For financial institutions: distinct segments justify tailored product design, more nuanced underwriting, and targeted messaging that lifts engagement.
- For policymakers: segment-specific interventions can address the different barriers each group faces, and the framework offers a repeatable way to track financial-inclusion progress over time.
Tools & techniques
Stack
Limitations & next steps
The analysis is cross-sectional and reflects 2019 economic conditions, and self-reported survey data carries response bias. Natural extensions include longitudinal panel analysis to track how households move between segments, alternative clustering methods (hierarchical and density-based), and a supervised model to predict segment membership for new households.
Read the full write-up
The complete methodology, annotated code and references are documented in the project repository.
Explore the repository